


A candlestick is a visual representation of the price development during a specific time frame. For example, a candlestick can show the price development in a specific hour, or a specific day or week.
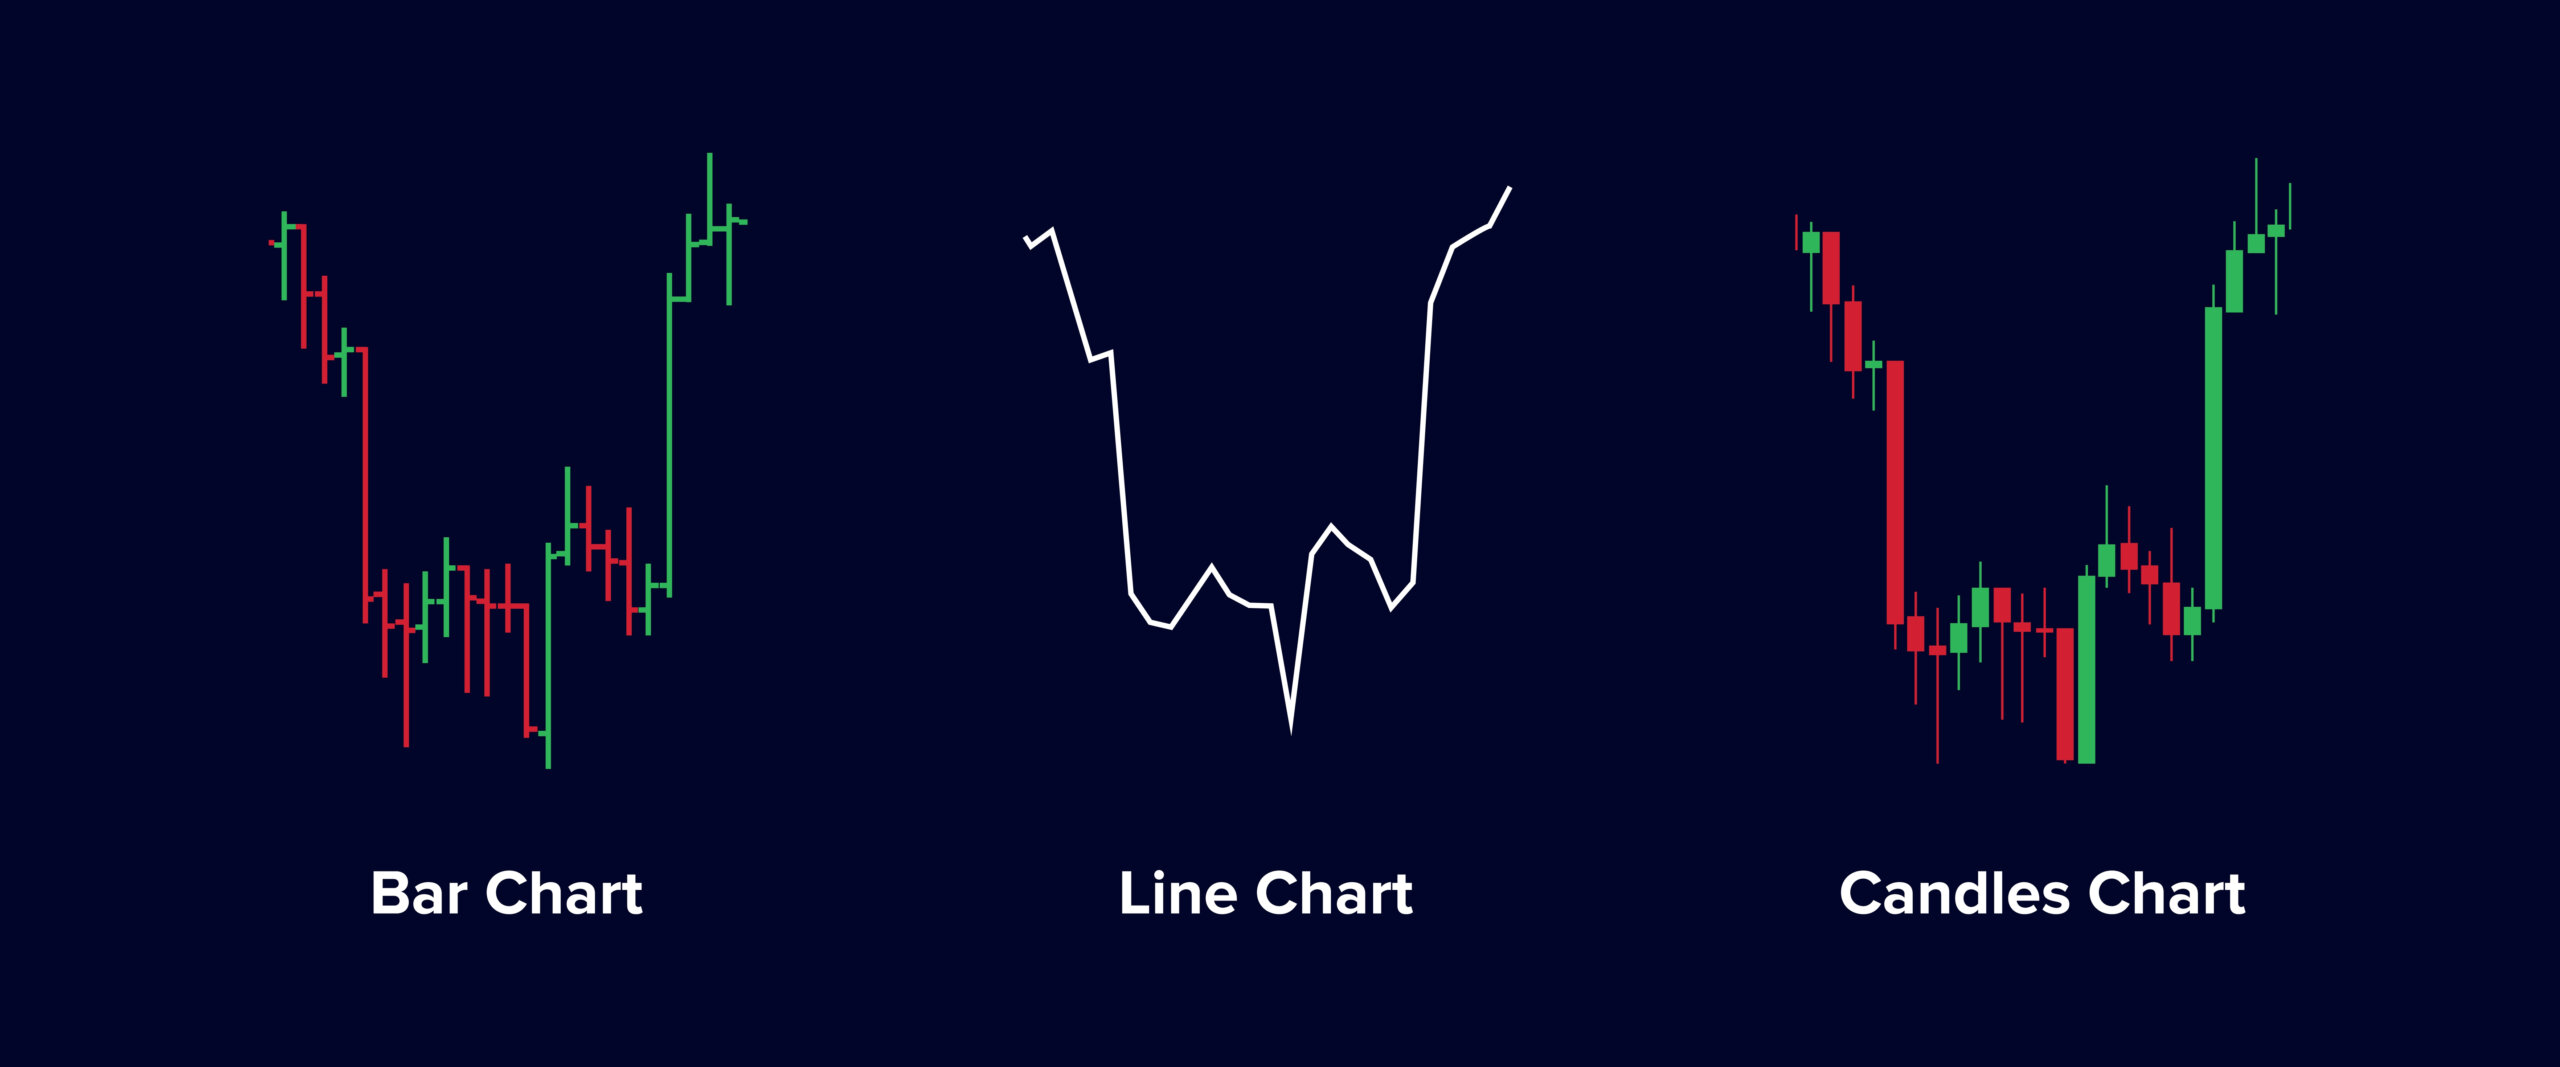
The candlestick owes its special name to the fact that it resembles a candle with a protruding wick (although we will see that candlesticks can also have all kinds of other shapes). This chart technique originated in Japan and has only been popular in the West for several decades. Compared with a so-called line chart a candlestick chart has the big advantage that for each period more information is available, because besides the open and close price the extreme price levels (during the period) can also be read.
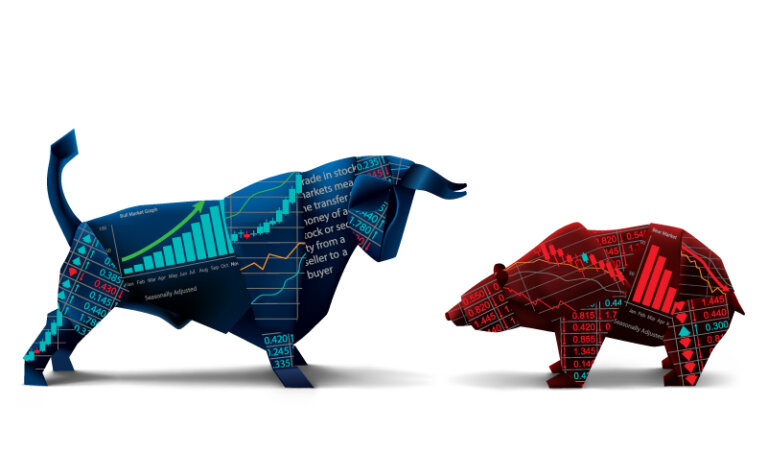
Bullish and bearish candlesticks
If the closing price (close) is higher than the opening price (open) we speak of a bullish candlestick. This means that the price has risen during this timeframe. These bullish candlesticks are usually green on the charts.
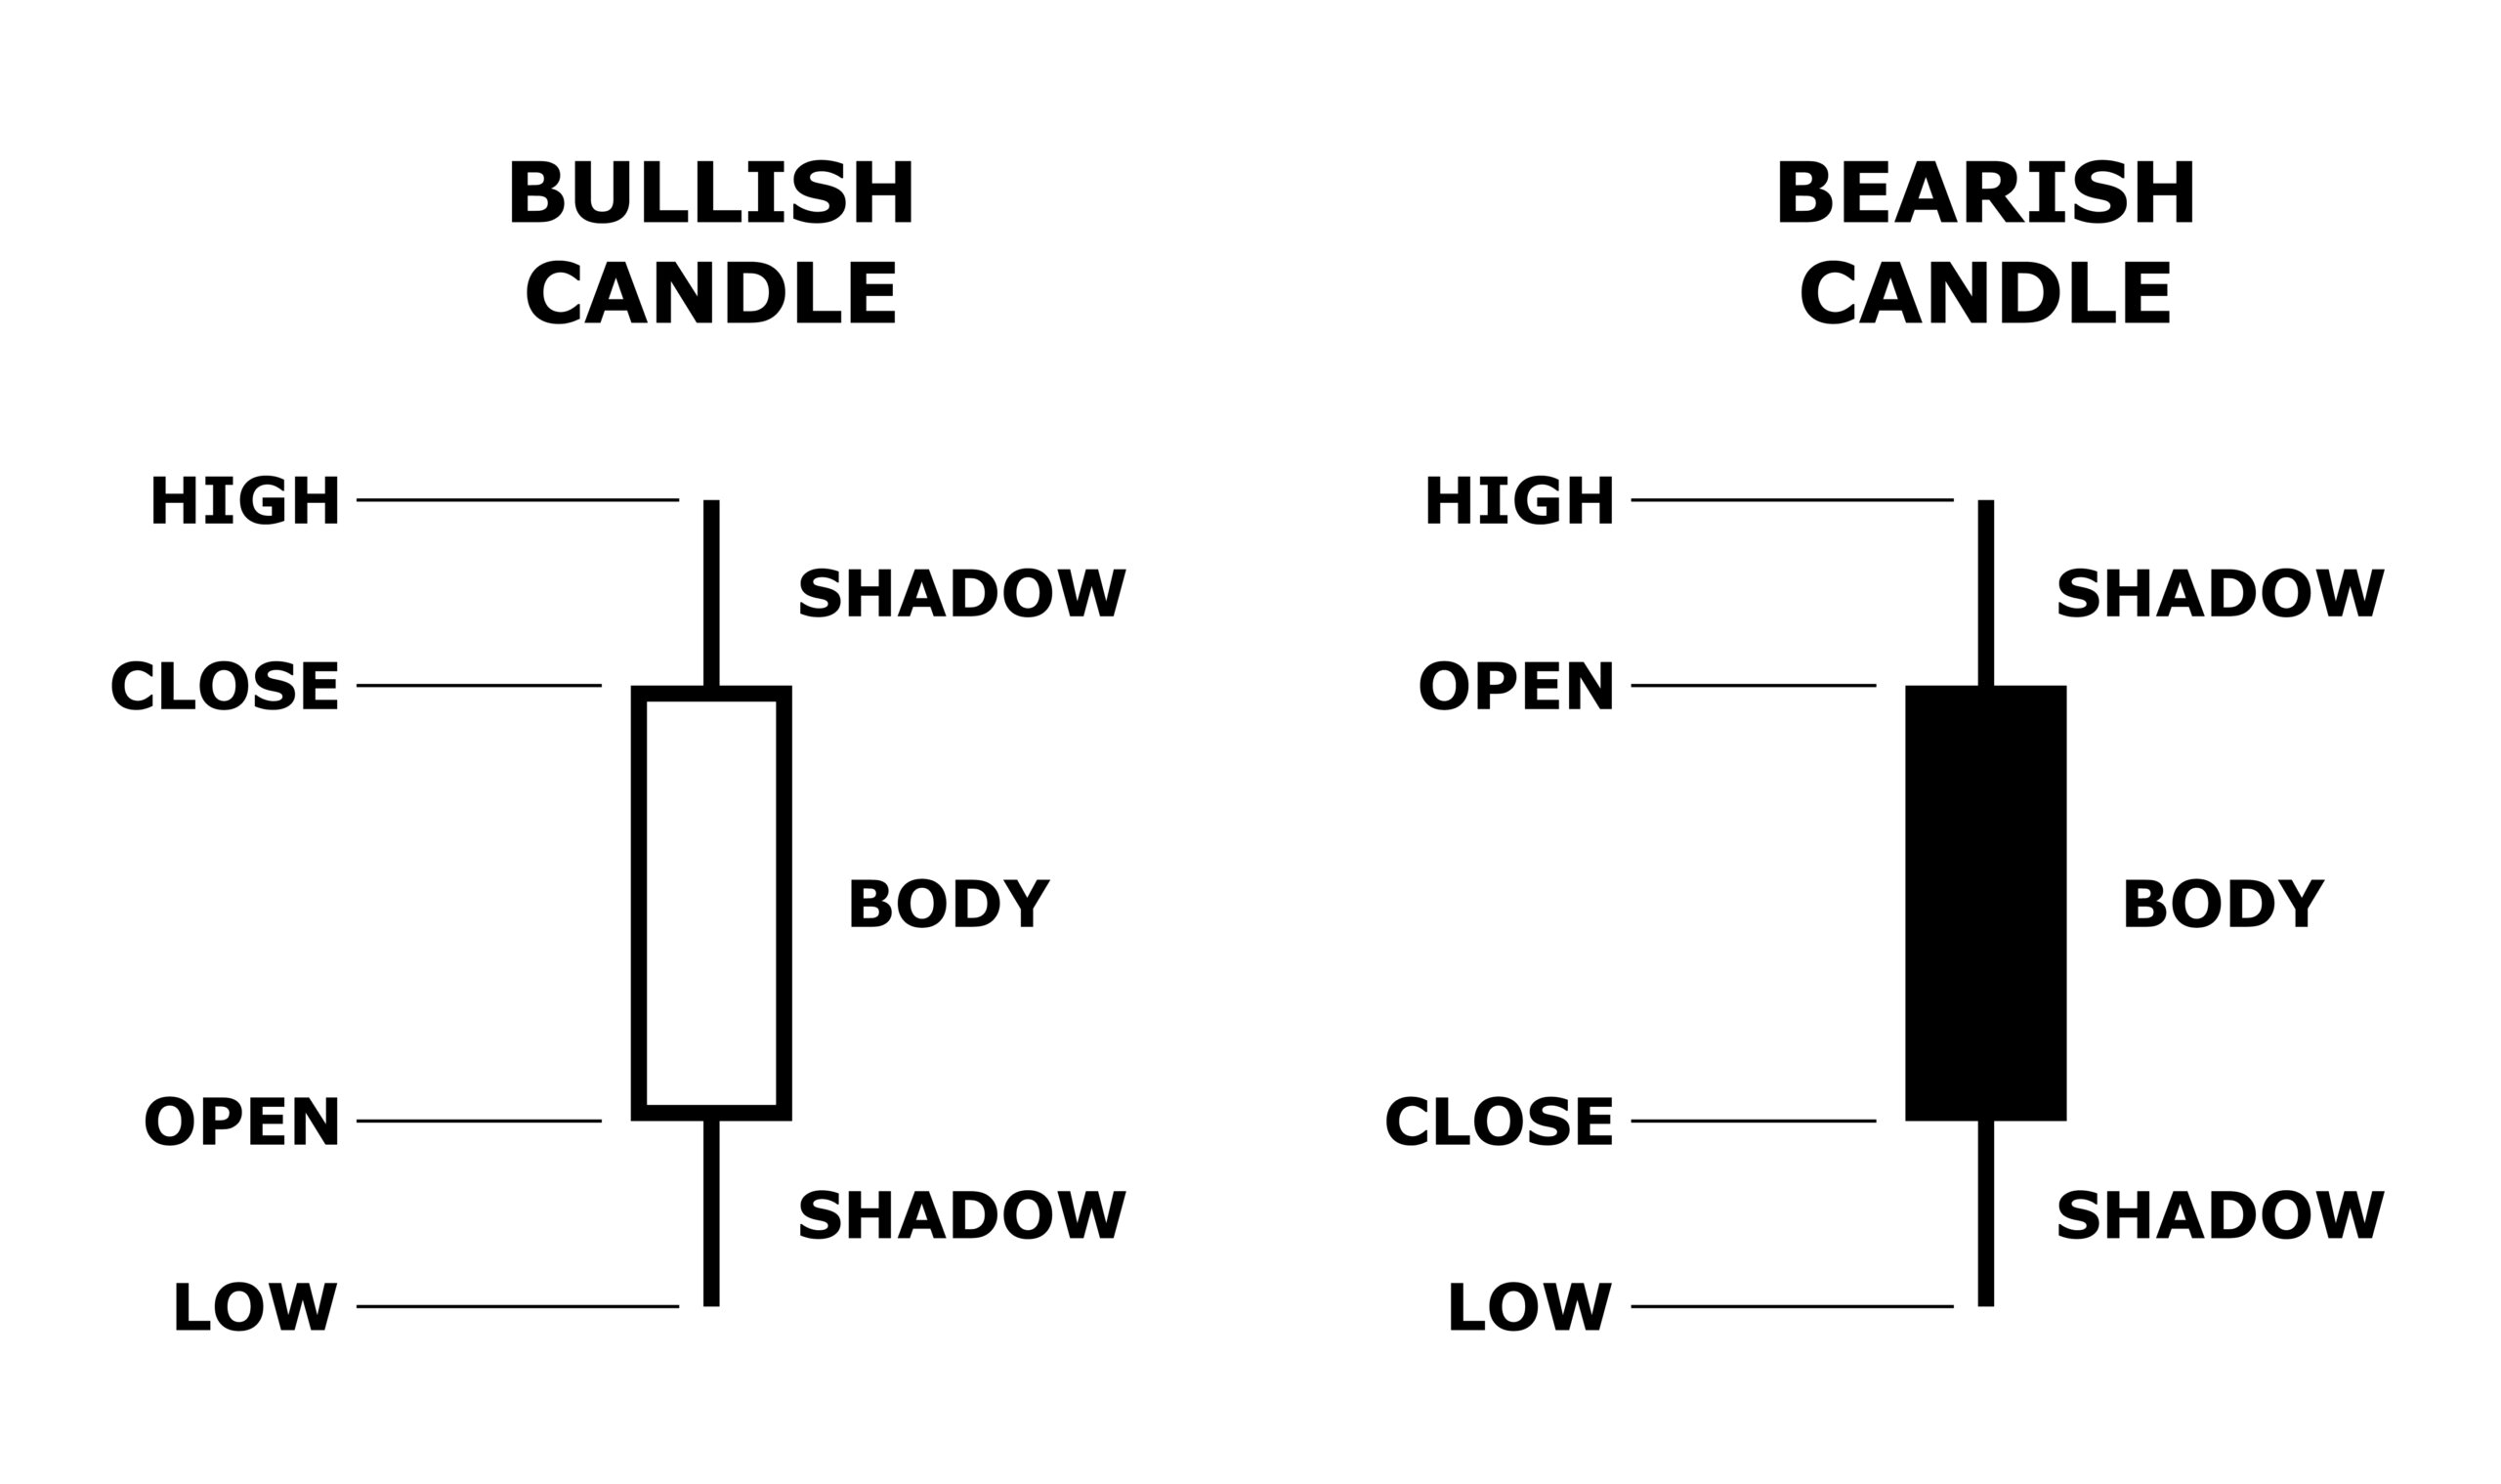
If the closing price is lower than the opening price we speak of a bearish candlestick: this means that the market has fallen in this timeframe. These candlesticks are red on most charts. If you use a chart yourself you can adjust the colors of the candlesticks to your own taste.
The body of a candlestick
The coloured part between the opening and closing price forms the body or bar of the candlestick. The thin lines above and below the body are called the shadows. The top of the upper shadow is called the high; the bottom of the lower shadow is called the low. These extreme values indicate the extreme price levels the price has reached within the period of the candle in question.
The shape of a candlestick provides information about the course of the market during the period covered by the candle. There are different shapes of candlesticks which can be created depending on how the price develops during that particular period. Thus you can encounter a long candle with short shadows, or on the contrary a small candle with long shadows. A candlestick with a small body indicates that there is little difference between the buying and selling activity, while a long body indicates that either the buyers or the sellers have a strong upper hand. If a bearish candle occurs with a long body, we can say that the bears are controlling the market. A bullish candle with the same long body indicates that precisely the bulls are (much) stronger during the period concerned.
The shadows of a candlestick
Just like the body the shadows of a candlestick can also give us important information about the market. With big shadows we can see that there has been trading far outside the opening and closing price of the period concerned. Conversely, short shadows mean that the trading price has not come far from the open and close price in the period.
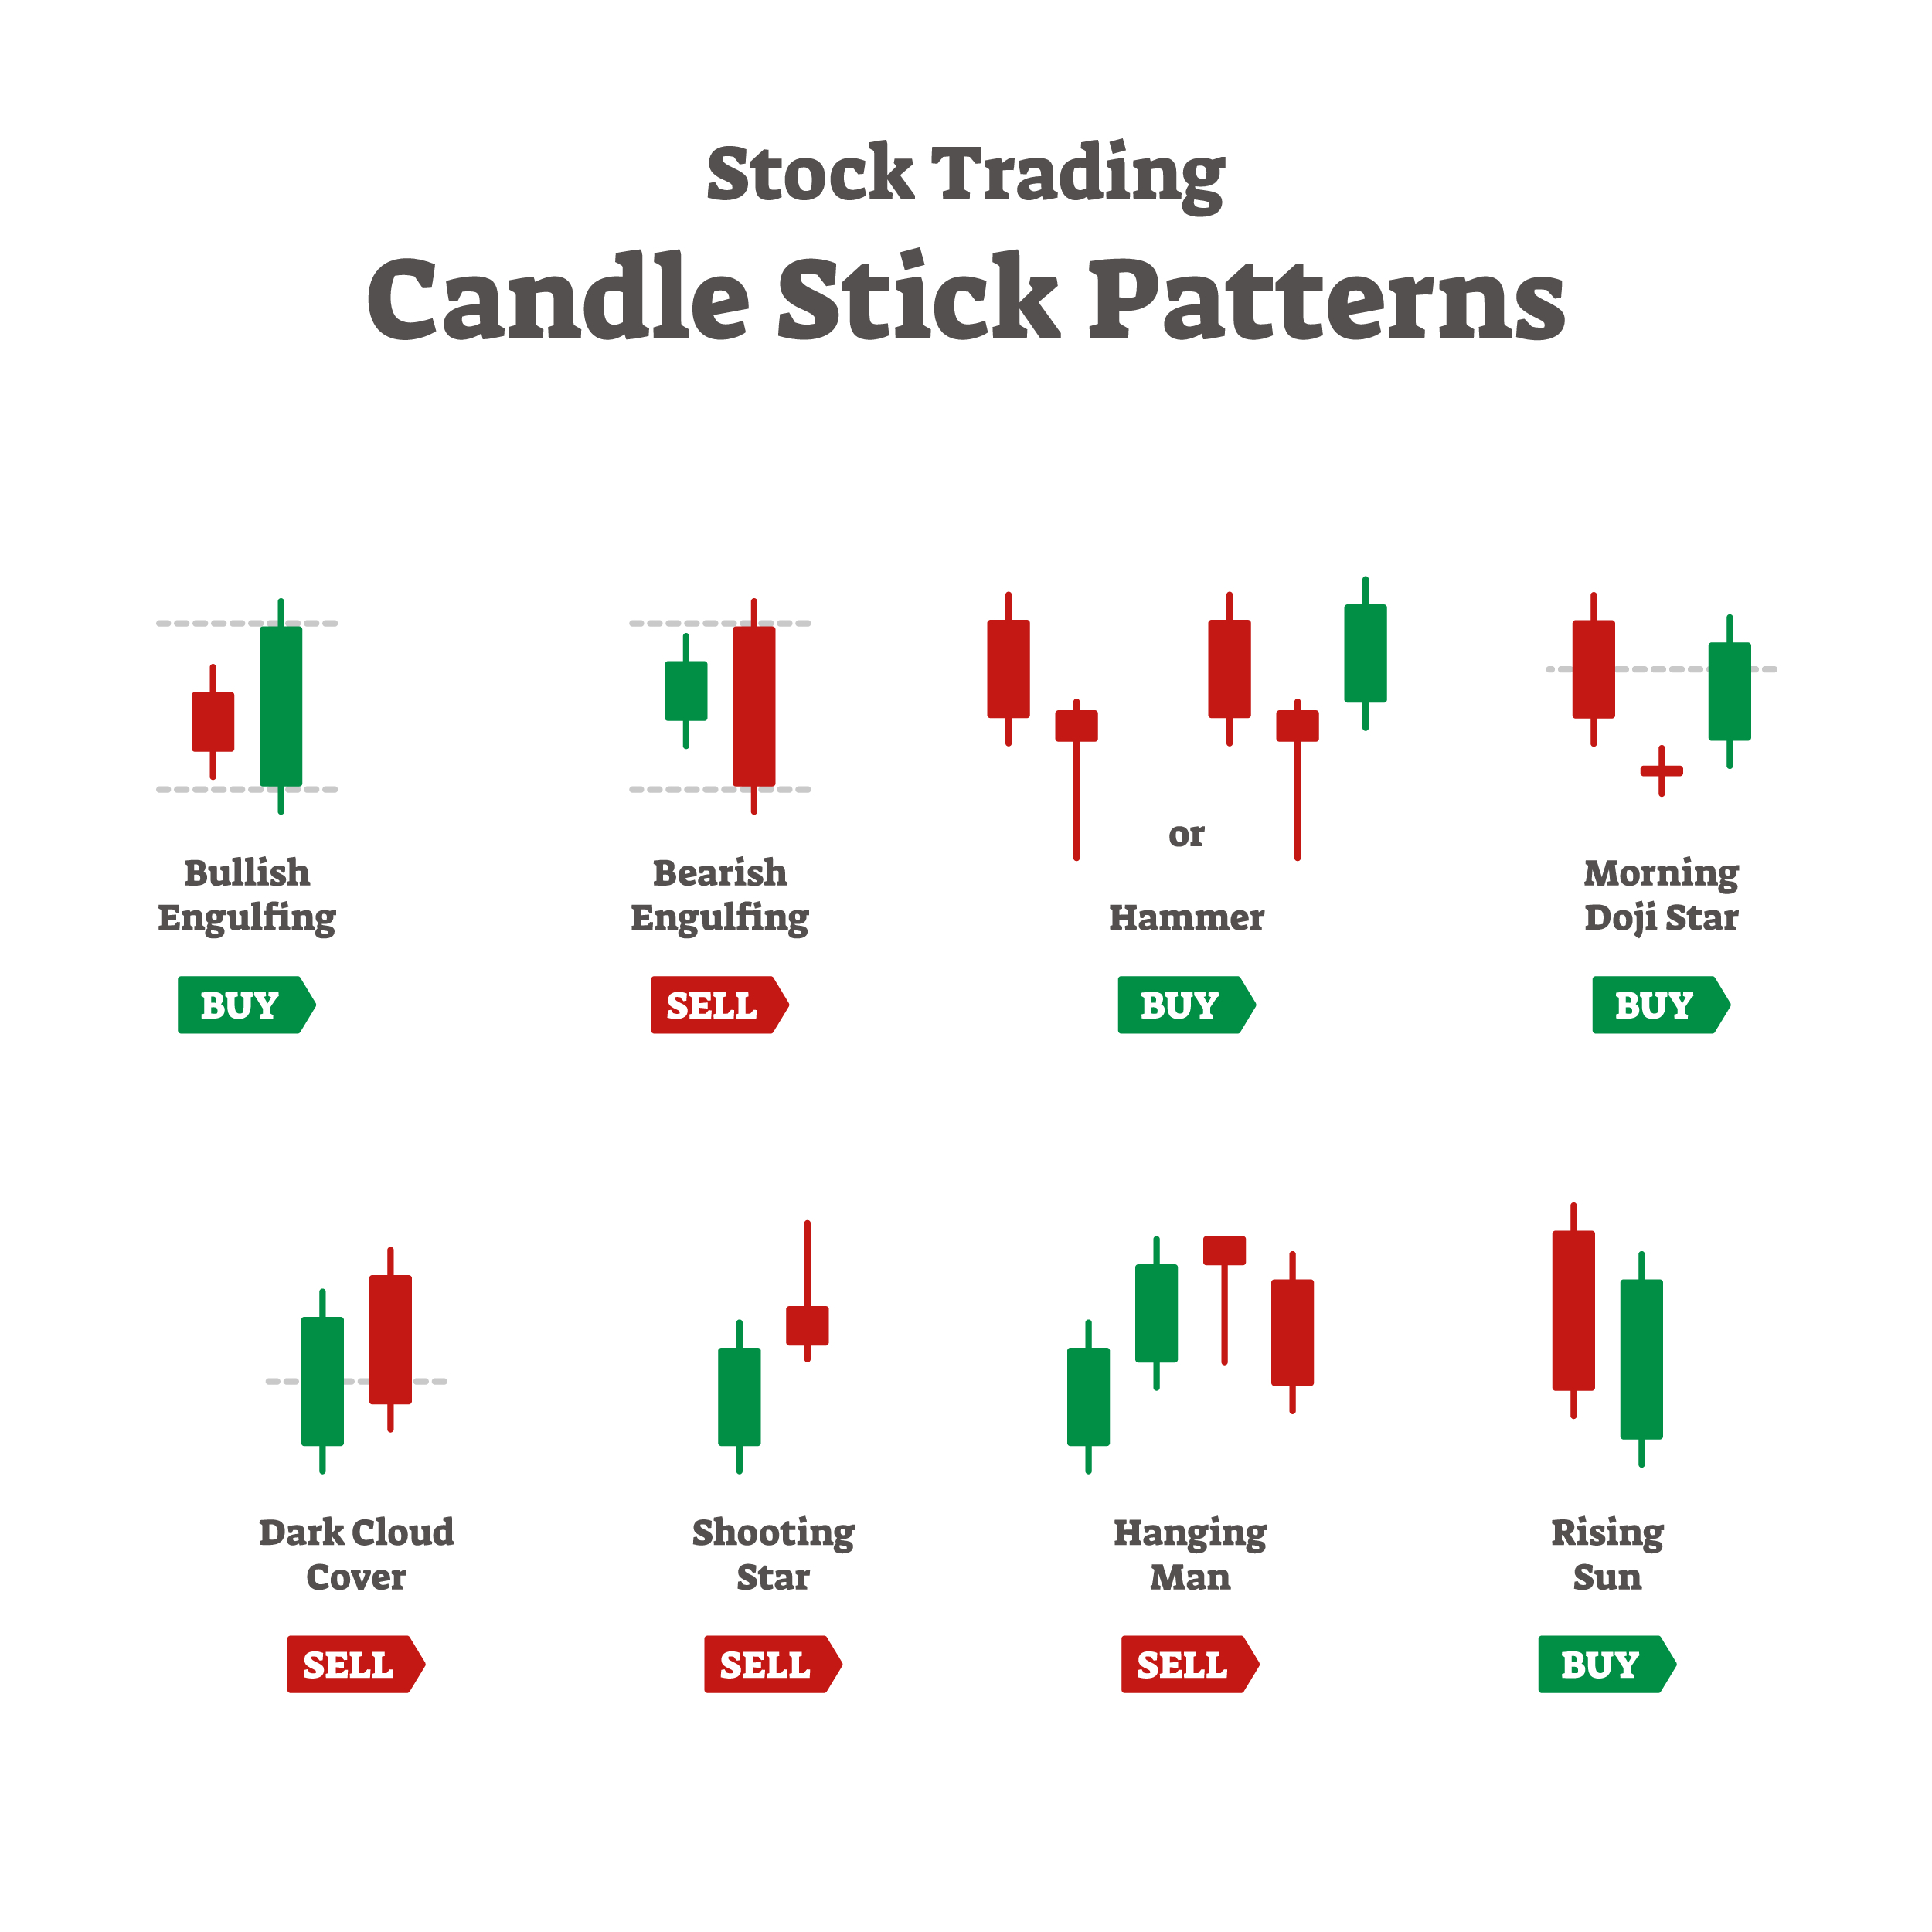
To get acquainted with the different types of candlesticks you can encounter in a chart, we will now cover some common shapes and explain what they mean. First we’ll start with some shapes that combine a small body with a long shadow.
A candle with a long upper shadow and a short lower shadow indicates that buyers have tried to push the price up during the period in question. However, for whatever reason, sellers have pushed the price back in the same period to get the close closer to (or even below) the open. A candlestick with a short upper shadow and a long lower shadow indicates that the sellers managed to force the price down significantly during the period. In this case, the buyers later came back strongly and pushed the price back up toward the opening price, or even above it.