


Traders and analysts are growing increasingly concerned after ETH prices movement has run aground on a significant roadblock at the 0.618 Fibonacci retracement level. ETH prices near term trajectory to overcome this technical barrier with other factors is where the pivotal moment for ETH lives today. It remains to be seen, however, whether this rejection is the beginning of a bigger correction or just the result of a temporary fake out before the upward motion resumes.
Key-Takeaways:
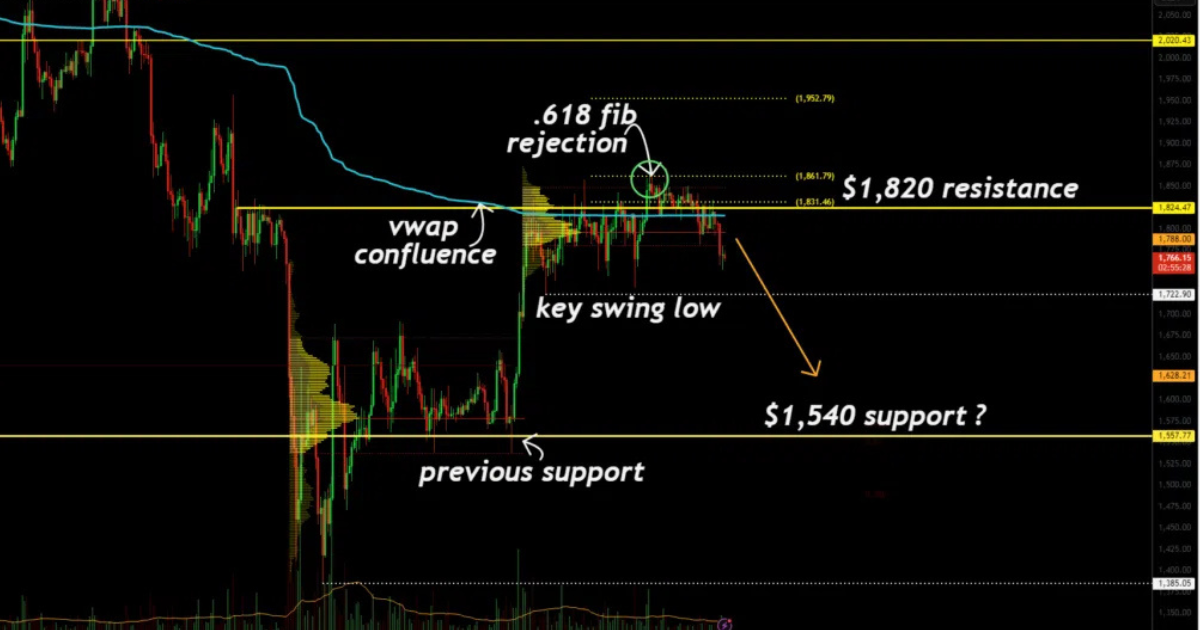
- ETH prices also face triple resistance at the daily horizontal resistance, descending VWAP, and the 0.618 Fibonacci level.
- The loss of the Point of Control indicates that sellers have taken over the short term market direction.
- A break below $1,550 could erase last week’s bounce and expose a potential 10% downside toward the next significant support level of the order book around $1,540.
- Traders should keep in mind that if buyers can take out the Point of Control and recent swing lows hold, then there is a possibility of a fakeout.
Technical Resistance Convergence

Meanwhile, ETH prices ran into a formidable resistance cluster where several technicals meet. Daily horizontal resistance and a descending Volume Weighted Average Price (VWAP) now form the technical ceiling extending beyond 0.618 Fibonacci level. It is a triple barrier that has thwarted buyers, who have tried several times to get over it. However, price advances continue to be rejected at this confluence zone as ETH has been forced to sit below the Point of Control (POC).
When the POC level is lost, This level holds significant technical importance. A break below this level indicates the weakest node (by volume) inside the current area of price action, which is usually the most important one. In the short-term market auction, sellers have taken control, with prices falling and a lower-high structure.
Potential Price Targets
The technical indicators are currently in line with a possible further continuation of the downside movement. Next support emerges around $1,540, or nearly 10 per cent below current levels. Trading this zone will be based on structural support from previous trading sessions combined with highest market inefficiency. Unfilled fair value gaps and single prints are also among the inefficiencies that tend to act as magnets for price action.
Although Market structure is not yet decisively bearish, but the failure to make higher highs or higher lows does show bearish tendencies. A broader correction usually follows on technical analysis. Traders should closely watch if the recent swing low fails to hold, which could now fuel the move to $1,540 target zone.
The Fakeout Possibility

On the bearish indicators, experienced traders are still wary of fakeout scenario possibilities. At similar rejection patterns, Ethereum proved to be capable of sudden strength. If buyers are able to hold on to the present price levels and be successful in reclaiming the Point of Control, then this rejection might prove to be temporary.
Holding current levels could invalidate the bearish structure and make another attempt to break above the 0.618 Fibonacci level. Traders should keep an eye out for volume increasing on rallies and reclaiming key levels, both of which are indicators that a fakeout scenario may be unfolding.
The current technical setup is significant for ETH traders and investors. Both directions may offer short term trading opportunities but long term investors will need to see if structural support lines hold. ETH prices trajectory over the coming week will likely hinge on the resolution of this technical standoff.
Conclusion: ETH Prices

Volume analysis completes the declining volumes on attempts to push higher support and a waning in bullish momentum. Conversely, if any sustained move beyond resistance is to be confirmed as breakout potential for ETH Prices, it will require surging volume. Technical traders continue to watch to see if prices can break above (for an uptrend) or below (for a downtrend) these critical decision zones.