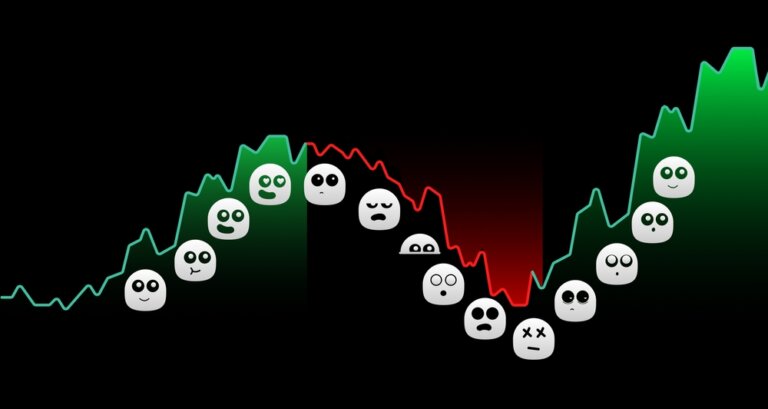


The Relative Strength Index (RSI) is a technical analysis tool in cryptocurrency trading that measures the speed and magnitude of price movements to determine overbought or oversold conditions. This helps traders predict potential price reversals and make informed decisions.
What is the Relative Strength Index (RSI)?
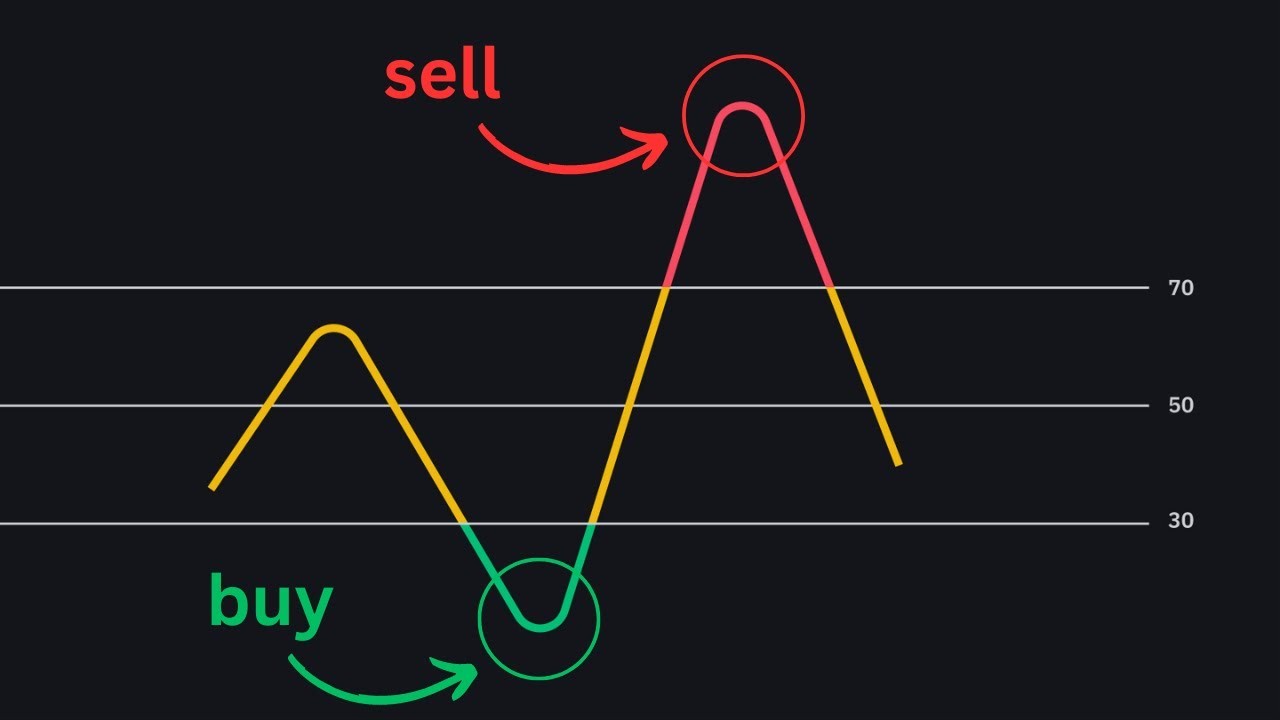
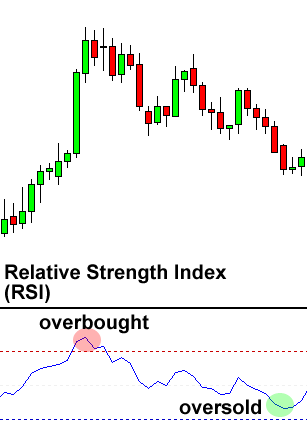
The RSI evaluates recent price changes to assess overbought or oversold conditions. An RSI above 70 indicates an overbought condition, which indicates a possible price decline, while an RSI below 30 indicates an oversold condition, which indicates a possible price increase.
How the RSI works
The RSI is calculated by taking the average of price gains and losses over a certain period (usually 14 days) and normalizing the result on a scale from 0 to 100.
- RSI above 70: Indicates overbought conditions, which points to a possible drop in price.
- RSI below 30: Indicates oversold conditions, which indicates a possible price increase
- RSI between 50 and 70: Indicates a strengthening market trend (bullish divergence).
- RSI falling towards 30: Indicates a weakening trend (bearish divergence), which implies selling pressure.
Importance of the RSI
The RSI is crucial for identifying bullish and bearish price momentum, helping traders confirm trend formations and determine optimal buying and selling moments. Specifically, it enables traders to:
 Detect overbought/oversold conditions: By identifying overbought and oversold levels, traders can anticipate potential price reversals.
- Assess trend strength: The RSI helps to estimate the strength of current trends, which is essential for making informed trading decisions.
- Generate trading signals: Traders use the RSI to generate buy and sell signals, especially when the RSI exceeds certain threshold levels (e.g. 70 and 30).
- Identifying divergences: RSI divergence (when the price moves in the opposite direction of the RSI) can signal a potential trend reversal and offers early entry or exit points.
How can you use the RSI?
Traders and investors use the RSI to identify potential entry and exit points, often in conjunction with other technical indicators to confirm signals and avoid false positives.
Advantages of using the RSI
Using the RSI offers several advantages for traders and investors:
- Simplicity: Easy to understand and apply, even for beginners.
- Versatility: Can be used in various market conditions and with different time frames.
- Complementary: Works well with other technical indicators to improve trading strategies.
Limitations of using the RSI
Despite its usefulness, the RSI has a few limitations that traders should be aware of:
- False signals: In volatile markets, the RSI can produce false buy or sell signals.
- Lagging indicator: As a momentum oscillator, it can lag behind real-time price movements, potentially missing the early stages of a trend.
- Overbought/oversold boundaries: The traditional boundaries (70 and 30) are not always applicable in all market conditions, requiring adjustments.
RSI calculation
The RSI is calculated using the formula RSI = 100 – (100 / (1 + RS)), where RS is the average gain of upward periods during the specified time frame divided by the average loss of downward periods. The result is plotted as an oscillator ranging from 0 to 100.
Conclusion
The RSI is a valuable tool for assessing the potential of an asset for a reversal or continuation of the current trend, and offers traders crucial insights to make informed decisions in the volatile world of cryptocurrency trading.