


The crypto market is in a crucial phase, in which both Bitcoin and Ethereum are showing technical weaknesses. This naturally raises the question: is the bull market over, or are we just experiencing a temporary correction?
In this analysis, we delve into the technical state of both currencies. We examine recent price developments, the most important support levels and resistance zones, and how indicators such as the RSI and EMA 200 influence the current trend.
Technical analysis Bitcoin
Three weeks ago, we discussed how the resistance around $108,353 proved too much of a hurdle. The price peaked at $109,588, forming a double top and a false breakout, which is often a bearish signal.
Bitcoin has now broken through the important support zone around $90,500, which could trigger a further decline. The price is currently supported by the EMA 200 around $85,645, but a close below this would mean a bearish continuation towards the next strong support zone around $73,777.
Daily chart Bitcoin (BTC/USDT)
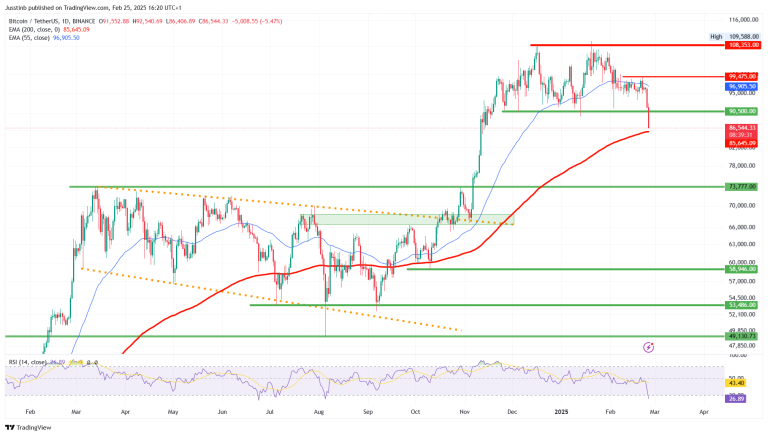
Since the failed breakout, momentum has been declining, which was confirmed by the negative divergence on the RSI. On the current chart we see that the RSI has now dropped to 26.89, an oversold level that indicates extreme selling pressure. This confirms that the downward trend is currently in the ascendancy.
Critical levels for the coming period:
Resistance: $90,500 (former support zone), $96,905 (EMA 55), $99,475 (high on February 21).
Support: $85,645 (EMA 200), with a potential follow-up to $73,777 if this level is broken.
Bitcoin is at a critical point and the long-term upward trend is coming under pressure. A recovery above $90,500 could be a signal that the bulls are returning. If the selling pressure continues and the EMA 200 is broken, the way is open to considerably lower levels. In short, caution is advised in the coming days.
Technical analysis Ethereum
In recent weeks, Ethereum has shown a downward trend, characterized by lower peaks and bottoms. However, this happened within the long-term upward trend. The technical condition of Ethereum is currently deteriorating further.
Ethereum daily chart (ETH/USDT)
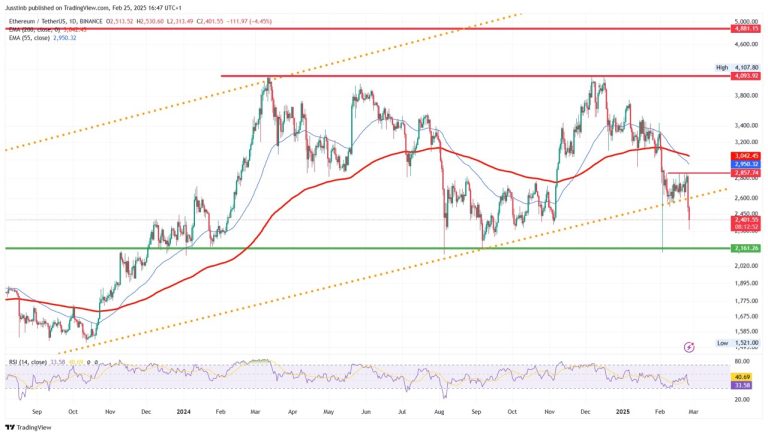
Ethereum recently broke through the orange rising trend line and is now on its way back to the support zone around $2,161. This is an important zone because it has previously functioned as a bottom and should prevent a further drop towards $1,500. However, as long as the rate remains below the EMA 200 and the recent peaks around $2,857, the technical picture remains bearish.
Critical levels for the coming period
Resistance: $2,857 and the EMA 200 at $3,042. A recovery above these levels would improve the technical picture. Support: $2,161 remains the last strong line of defense. A break below this level could cause a further decline towards $1,500.
The downward breakout from the rising trend channel and the loss of the EMA 200 are serious warning signs. Bulls must quickly regain control, otherwise the price could fall back towards $2,161 and possibly lower.